

USD/TRY testing all time highs
(Gregor Horvat – Wavetraders)
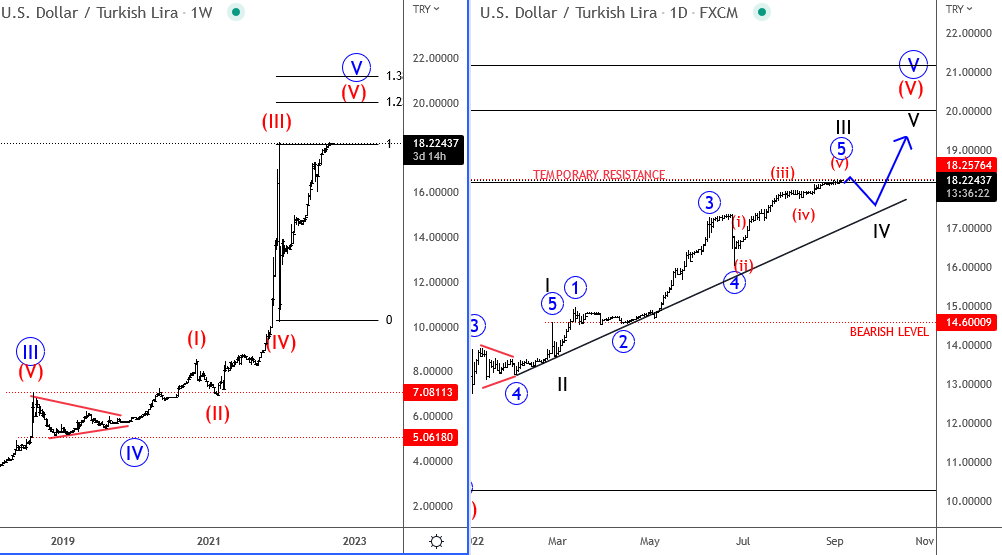
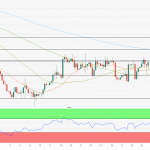
USD/TRY is in uptrend after a sharp drop back in 2021 which was seen as wave IV correction. Notice that recovery is now very strong back to new highs, which can be counted in an impulsive fashion so we think there will be more gains after any retracement. There can be some pullback coming away from temporary resistance now, ideally into wave IV which may find a base at the black trendline.
Big picture
Higher degree impulse can be in late stages with current five subwaves with blue wave V. Frist upward level is at 20.00 where bulls can slow down, but next extension targets show room even for 25 and 30.
Ichimoku cloud analysis: EUR/USD, USD/CAD, AUD/USD
(RoboForex Team)
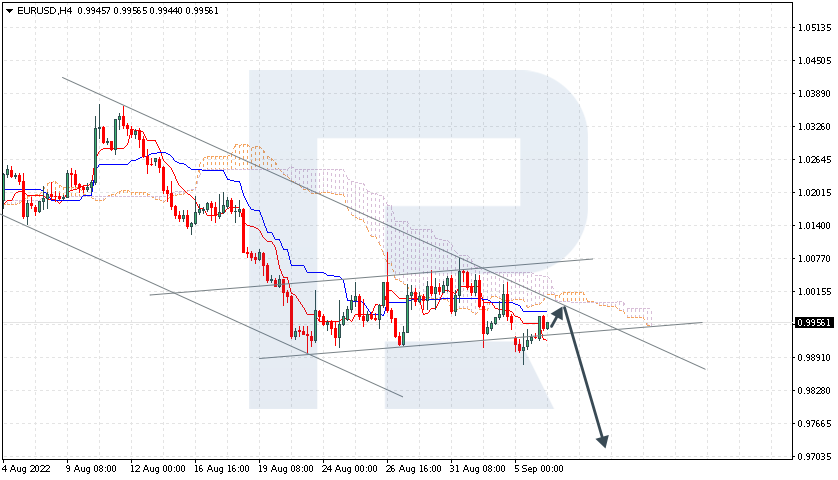
EUR/USD, “Euro vs US Dollar”
The pair is testing the signal lines of the indicator upon bouncing off the support area. It is moving under the Ichimoku Cloud, indicating a downtrend. A test of the lower border of the Cloud is expected at 0.9985, followed by falling to 0.9735. An additional signal confirming the decline will be a bounce off the upper border of the bearish channel. The scenario can be cancelled by a breakaway of the upper border of the Cloud and securing above 1.0085, which will mean further growth to 1.0175. The decline can be confirmed by a breakaway of the lower border of the bullish channel and securing under 0.9890.
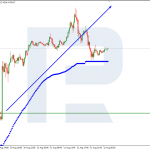
USD/CAD, “US Dollar vs Canadian Dollar”
The pair is correcting inside the bullish channel, going above the Ichimoku Cloud, which means an uptrend. A test of the upper border of the Cloud at 1.3045 is expected, followed by growth to 1.3305. An additional signal confirming the decline will be a bounce off the lower border of the bullish channel. The scenario can be cancelled by a breakaway of the lower border of the Cloud and securing under 1.2970, which will indicate further falling to 1.2875. The growth can be confirmed by a breakaway of the upper border of the descending channel and securing above 1.3170.

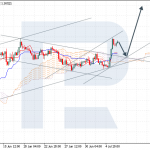
AUD/USD, “Australian Dollar vs US Dollar”
AUDUSD has secured under the support level, going under the Ichimoku Cloud, which means a downtrend. A test of the Kijun-Sen line at 0.6825 is expected, followed by a decline to 0.6635. An additional signal confirming the decline will be a bounce off the upper border of the descending channel. The scenario can be cancelled by a breakaway of the upper border of the Cloud and securing above 0.6945, which will entail further growth to 0.7035.

EUR/USD daily bullish counter trade
(Nenad Kerkez – Top-XE)
EUR/USD technical analysis
- EUR/USD Morning star/CBR combo.
- Daily is strongly bullish.
- Pinbar rejections.
- 1.0020 is the ATR projection high.
- 1.0079 is the potential target.
MEGATREND MAs: Bearish
D1 chart EUR/USD

1. Support line
2. Swing high
3. Pinbar rejections
4. Morning Star emerging/CBR
5. Final bullish target
The EUR/USD has a strong momentum on a daily time frame. We can see that the price is making a bounce above the horizontal line of support which is in line with M L3 pivot point. We might expect the price to push further up if the level holds. The first intraday target is 1.0019 which is the ATR projection high. A strong open is characterized by CBR and Morning Star patterns off the support. Both are bullish. This is a counter-trend trade.
The entry came after the Morningstar/CBR signals. As I am a bit late in the entry I entered with 0.5 % risk and I will add 0.5 % on a retracement towards 0.9840. I expect the bullish move to continue as the ECB signaled more aggressive monetary policy.
Read FX daily: Equity divergence is becoming more relevant
Related posts:
 Forex Trading Analysis: USD/JPY, USD/CHF, AUD/USD, EUR/JPY, USD/CAD
 Forex Analysis: GBP/USD, AUD/USD, USD/CAD, Brent, S&P 500
 Ichimoku cloud analysis: USD/CAD, EUR/USD, AUD/USD
 Forex Forecast: Gold, USD/JPY, GBP/USD, AUD/USD, USD/CAD
 Forex Outlook: USD/CNH, USD/JPY, Ichimoku cloud analysis
Ichimoku cloud analysis: AUD/USD, XAG/USD, GBP/USD
Forex Outlook: USD/CNH, USD/JPY, Ichimoku cloud analysis
Ichimoku cloud analysis: AUD/USD, XAG/USD, GBP/USD
 Forex analysis: GBPUSD, XAUUSD, USDCAD, EURUSD
 EURUSD and Silver Forecast