


ForexChief
Read Best Forex Trading Indicators
They create optimal market price, and synchronous trade together with them considerably increases chances of success for any trader.
It is a little theory
The Volume Spread Analysis trading method revealing manipulations and transactions of «smart money», promptly gains popularity. It is the imbalance of supply/demand that creates a price movement on the market. If as a result of the analysis you understand where and with what interest (volume) the «big players» are watching, we open our deal in the same direction. If conventional technical indicators additionally support the trading signal, the probability of success increases. Necessary dynamics is controlled by means of indicators of tick volume.
Theoretically, at any moment market volumes on demand and supply have to match, otherwise requests just will not be carried out − the price will not change. For example, the more there will be a demand, the quicker «the market will swallow» cheaper requests, as a result − the price has to grow. When the point of market balance is reached, volumes of the sentence will exceed readiness of participants for purchase − to the market it is necessary to reduce the price and the probability of the descending trend increases.

Problems with the correct identification arise quite often. For example, emergence on the histogram of big red bar on the descending trend means an entrance of large volume. Most of beginners has a desire at once to enter or add volume to already open transactions for sale, but as a result the price has gone up – it was the usual «trap of sellers». The large player «has just pushed out» from the market small volumes − has collected StopLoss of those who on this bar have hurried to open sale. To avoid a similar mistake, it is necessary to analyze volumes before still emergence of key bar on the histogram of the indicator of volumes. If the general level of volume low (there is nobody to support the strong descending movement!) that will be dangerous to open new transactions for sale.
What exactly does VSA analyze?
The volume of transactions or the amount of money that participants pour into the market is the main effort to create a movement, and price is the end result of this process.
Basic concepts of methodology:
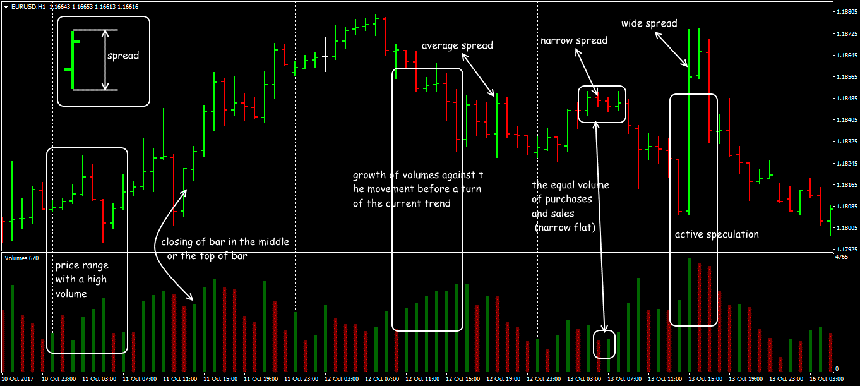
- Spread The full range of the bar (from the price high to the low price); it is believed that there are three types − wide narrow and medium, calculated in relation to the previous bars (usually from 3 to 100). The spread shows, how actively there are biddings in a current period.
- Closing price of the bar
- Trading volume
For Forex assets − the tick volume (total quantity of transactions); on future assets − the actual volume of transactions (in money). That who trades in currency pairs on Forex, but doubts the VSA methods on tick volumes, we recommend to trace dynamics of similar currency futures − as a rule, they advance the movement currency Forex pairs by 1-3 bars.
Advertisement

Bars are classified as down-bar (the closing price is lower than the similar price of the previous bar) and up-bar (respectively, if the closing price is higher than the previous one).
Through the dynamics of volumes and their ratio with spreads, the trader must correctly assess the interest (the direction of transactions, the purposes and orders of StopLoss) of market makers and large participants in order to use them in their trade.
Basic principles of Forex Volume Spread Analysis
So, VSA operates as follows:
- strong directional price movement in the market occurs under the influence of large volumes (purchases / sales) of a trading asset;
- large volumes are formed by large traders − national banks, commercial banks, hedge funds, private players, who realize their interests, as well as the interests of their clients;
- the analysis is conducted in the direction from the senior timeframe to the younger one;
- trending channels and support / resistance levels are necessarily analyzed (from min / max bars with high volume);
- optimal VSA (we remind!−volume spread) analysis is conducted in a closed market.
Analysis by the VSA methodology implements two main objectives:
- The moment of the end (or reversal) of the trend
The VSA signal is a relatively low volume of trades with a small spread after strong directional movement.
- Determination of the strength and direction of the trend
Bullish volume − a synchronous growth in volume on green bars and a decrease in the red, that is, there are buyers on the market ready to continue buying at a price increase. This means that large players on green candle bars − always buy, and on red − do not sell. Bearish volume − growth in volume on red bars and a decline in green. The downward market is determined by bullish candles. This means that large players on green bars − do not buy, but on red − necessarily sell.

The decrease in volumes on the upward trend testifies to the market entry into a state of overbought, that is, the existing market price of buyers does not suit and in the near future one should expect a trend reversal. For a downtrend − we argue similarly.
Today a trader has access to many technical Volume Spread Analysis indicators that analyze all known combinations of candles, and potential entry points show the color and height of bars of the histogram. Consider the two most popular indicators.
VSA indicator WSD HISTOGRAM
The spread volume analysis indicator processes data of tick volumes and shows an assay value on the colour chart. Histogram indicator each bar shows the last (or any other bar) spread, which is additionally indicated in the information board on the right (white numbers). Gray diamonds − the trend of neutral, red diamond − the market «bears» more − signal to SELL, green diamonds − market «bulls» are prevalent in current transactions − signal to BUY.

The main setting parameter is MA_Length − the moving average period (default is -100) to estimate the average spread value.
VSA indicator Better Volume
Represents the colour histogram in an additional window. In calculation of BetterVolume considers the strongest candle combinations and combinations of Price Action, displays values of volumes height of columns and colour marking. To visually «filter out» high and low volumes, a moving average is applied to the volume histogram.

If there are no serious volumes, the histogram is coloured in basic blue colour. As the complementary filter is used by MA(100) (the MAPeriod parametre can be changed) − at intersection of the line the histogram signal intensity increases. The NumbersOfBars parametre defines the number of the bars which are displayed on the screen; the LookBack parameter defines quantity of candles for the analysis, value by default (20) is effective practically on all assets.
Several practical notes
We recommend to read curious materials about the Wyckoff method and also the book by Tom Williams «Master the Markets».
You can not perceive the VSA technique as a solution to any problems: its logic and recommendations do not take into account fundamental analysis. The trader has to assess a situation in general and only then check as far as VSA pattern can be profitable. Want an example? Every month, there is a stir before the publication of Non-Farm Employment Change statistics and, as a rule, after publication there is a speculative reaction of almost all trading assets. VSA patterns created on similar news often are false, moreover, even several days later in the market speculative «echo» can sound.
The VSA indicator Forex does not give accurate signals for the opening of the position, but allows you to estimate the volatility of the asset and the relative value of the volume at each time. A sharp change in the volume dynamics will inform the trader in time that a significant amount of money is pouring into the market, then its task is to correctly interpret the results. Market makers don’t enter the market instant volume on one price, and gradually accumulate a position and spray the interest in some narrow price range therefore for a scalping VSA technique practically doesn’t make sense.
In none of the versions there are descriptions of clear signals, and sometimes the indicator generates absolutely illogical signals, especially in those cases when the previous candle before the signal has a large «body». This violates the logic of the trader, but in general, the indicator can be easily integrated into any trading strategy as a filter of false signals, and also it will be effective for wave analysis complete with Fibonacci and oscillators.
Sometimes the situation on the histogram of the indicator of VSA forex indicator outstrips the standard stochastics, especially before the end of the trend or before the beginning of correction. The appearance of a green or red bar focuses the trader’s attention on the current situation. However, the priority of a trade decision should be in the usual signal, if, for example, a white bar appears, then to enter the market you need to wait for the breakdown of the trend line, and even after the retest of the support/resistance line.
Before trading GOLD (XAUUSD)
Professional traders check the market regime first:
- Is the market window OPEN or CLOSED?
- Should I favor BUY or SELL?
- How risky is the current regime?
👉 Follow the Gold Decision Engine (market context — not a signal service)
View Gold Decision Engine →Related posts:
 How Can I Start Forex Trading in 2026? A Complete Beginner-to-Pro Guide
 What Is Forex Trading? Beginner Guide 2026 (Complete & Honest)
 How Forex Market Works (Explained Simply) – Beginner Guide 2026
 What Are Currency Pairs in Forex? Beginner Guide 2026
 How Forex Trading Makes Money – Beginner Guide 2026