No Result
View All Result
Sunday, June 26, 2022
  • Login
FXVNPRo
ADVERTISEMENT
  • Home
    • Advertising Promotion
    • Best Brokers 2022
    • Economic Calendar
    • Contact Us
  • Forex Brokers Review
  • Learn To Trade
    • Promotional Content
    • Forex News
  • Forex Promotions
    • Best Promotions
    • Forex No Deposit Bonus
    • Forex Demo Contest
    • Forex Cashback Rebate
    • Forex Deposit Bonus
    • Forex Live Contest
    • Affiliate Program
    • Other Promotions
  • Expert Advisors
    • Expert Advisors Price
No Result
View All Result
FXVNPRo
No Result
View All Result
Home Learn To Trade

Technical Analysis – Price Action Trading (Part 1)

fxvnpro by fxvnpro
May 22, 2022
in Learn To Trade
3
Technical Analysis
0
SHARES
35
VIEWS

Read Introduction to Technical Analysis

Types of Forex Charts

Forex traders use charts to determine market direction and identify possible buying and selling opportunities. There are three types of charts commonly used in Forex that you can flick between on MT4:

  1. Line chart;
  2. Bar chart;
  3. Candlestick chart.

Line Chart:

These charts are handy for quickly determining the trend – only the current/close price is graphed – as such these charts should not be used for placing stop loss or take profit orders.

Technical Analysis

Bar Chart:

The chart is created with the use of bars where each bar has a high (top) and a low (bottom) with a line on either side; right side being the opening price and the left side being the closing price for the selected time period.

Technical Analysis

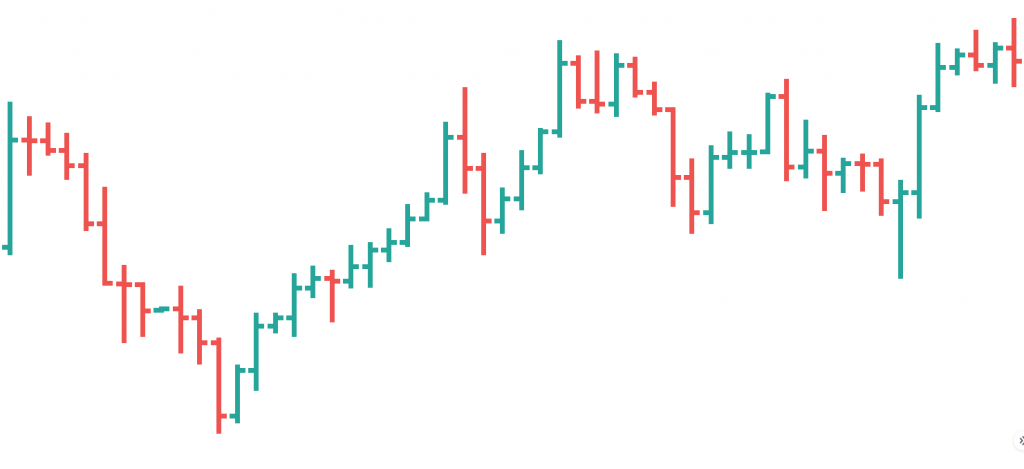
Different colours can be used to identify bars that close higher than the open (bull or up bars) or lower than the open (bear or down bars). The example above has green lines for up bars and red bars for down bars. These charts show all the information you need but most traders and analysts tend to favour the third option – Candlestick charts.

Candlestick Chart:

This chart is created much like bar charts, with the only difference being that candlesticks add dimension and colour to the Bar Chart by depicting the area of the bar between the open and close as a two dimensional real body.

Technical Analysis

Candlesticks are comprised of a body which represents the difference between the open and close prices. An up candlestick occurs when the close is higher than the open – and down candlesticks occurs when the close is lower than the high. In the chart example above, up candlesticks are green whilst down candlesticks are red. If the open is equal to the close there will not be a body, just a line – this type of candle is referred to as a “Doji”.

The thinner lines extending beyond the body are called ‘Wicks’ – above the body is the high and below the body is the low for the selected time period. A large wick (relative to the body), indicates a potential turning point (support/resistance).

Which type of chart do you prefer trading off? Flick between the three on your MT4 Forex demo account.

Read Technical Analysis – Price Action Trading (Part 2)

Source: VT Markets – Earn Cash Bonus By Referring Your Friend | VT Markets

Post Views: 148

Related posts:

Technical AnalysisIntroduction to Technical Analysis Technical AnalysisTechnical Analysis – Price Action Trading (Part 2) Technical AnalysisTechnical Analysis – Price Action Trading (Part 3) cryptoslearntotradeCryptocurrency vs Forex Market – Similarities and Differences MiTRADEForex Brokers Types: ECN VS Market Makers VS No Dealing Desk WELTRADEReview Weltrade LitecoinWhat Is Litecoin? TetherWhat Is Tether (USDT)?
Tags: Bar ChartCandlestick ChartForex tradersLine ChartTechnical analysisTypes of Forex Charts
exness
Previous Post

TRADE2WIN Contest | Weltrade

Next Post

Technical Analysis – Price Action Trading (Part 2)

fxvnpro

fxvnpro

Next Post
Technical Analysis

Technical Analysis - Price Action Trading (Part 2)

Comments 3

  1. Pingback: Technical Analysis - Price Action Trading
  2. Pingback: MT4 vs MT5: What trading platform to choose?
  3. Pingback: Best Forex Trading Indicators

Leave a Reply Cancel reply

Your email address will not be published. Required fields are marked *

Stay Connected

XM
  • Trending
  • Comments
  • Latest
PrimeXBT

Step2earn Contest (06.06.22) | PrimeXBT

May 31, 2022
Tiomarkets

TIOmarkets: Client Sentiment Analysis And Trading

April 16, 2022
XTrade

Xmas Season Bonus (26.12.21) | XTrade

April 27, 2022
NordFX

Super Lottery 2022 | NordFX

May 12, 2022
FPMarkets

What is Forex Trading? (Part 1)

25
ForexNews

Key Trading Levels: AUD/USD, EUR/USD, GBP/USD, NZD/JPY, other currencies, USD Index, and SP500

14
Tiomarkets

Learn how to start trading Cryptos

11
CMC Markets

What Is Bitcoin?

9
Forex Chief

Trading Indicators – Forex on balance volume

June 25, 2022
MACD

Trading Indicators – Moving Average Convergence Divergence

June 25, 2022
N1CM

50% First Deposit Bonus | N1CM

June 25, 2022
Tiomarkets

MT4 vs MT5: What trading platform to choose?

June 25, 2022

Recent News

Forex Chief

Trading Indicators – Forex on balance volume

June 25, 2022
MACD

Trading Indicators – Moving Average Convergence Divergence

June 25, 2022
N1CM

50% First Deposit Bonus | N1CM

June 25, 2022
Tiomarkets

MT4 vs MT5: What trading platform to choose?

June 25, 2022

Advertisement

fbs


300_250_en stocks

Connect to FXVNPRo

facebook twitter telegram

Now online

FXVNPRo

FXVNPRo Information

Address: Ho Chi Minh City, Vietnam, 70000

Contact us:
– Skype: fxvnpro
– Email:

admin@fxvnpro.com

fxvnpro@gmail.com

Payment methods:
– Webmoney
– Perfect Money
– Paypal
– Skrill
– Neteller
– Bank Wire
– Bitcoin

Disclaimer

Any promotions, reviews, and other information in the website are just for the information purpose only.

There is no invitation or encouragement to invest in the Financial Market such as CFDs, Forex, Binary Options, Indices, Cryptocurrencies and so on. We disclaim liability for any loss resulting from the use of information contained on this website.

The published comments are private opinions or feedback of the users. FXVNPRo is not responsible for any information on the website.

Risk warning

Please be aware of your investment into trading markets which is high risk and not suitable for everyone.

Recent Posts

  • Trading Indicators – Forex on balance volume
  • Trading Indicators – Moving Average Convergence Divergence
  • 50% First Deposit Bonus | N1CM
  • MT4 vs MT5: What trading platform to choose?
  • Cash Puzzle – Cash Prize Up To $15000 | Weltrade
  • Up To 30% Deposit Bonus | Errante
  • Boost Stars Campaign | Rakuten Trade
  • CEO Challenge 2022 | Fullerton Markets
  • Free $5 Rookie Accounts | XSocio Markets
  • 100% ALLSTAR Bonus | RallyTrade

© 2013 - 2022 FXVNPRo - Forex Expert Advisors | Forex Promotions | Forex News.

No Result
View All Result
  • Home
    • Advertising Promotion
    • Brokers Listing
    • Economic Calendar
    • Contact Us
  • Forex Brokers Review
  • Learn To Trade
    • Promotional Content
    • Forex News
  • Expert Advisors
    • Expert Advisors Price
  • Forex Promotions
    • Best Promotions
    • Forex Demo Contest
    • Forex No Deposit Bonus
    • Forex Cashback Rebate
    • Affiliate Program
    • Forex Deposit Bonus
    • Forex Live Contest
    • Other Promotions

© 2013 - 2022 FXVNPRo - Forex Expert Advisors | Forex Promotions | Forex News.

Welcome Back!

Login to your account below

Forgotten Password?

Retrieve your password

Please enter your username or email address to reset your password.

Log In