


ForexChief
Read Best Forex Trading Indicators
The trading method of convergence / divergence of moving averages is used to assess balance of buyers/sellers, strength and direction of trend, as well as the search for turning points.
Mathematics and parameters
MACD shows what is declared in the name – as moving averages are mutually located. Three MA are applied in Moving Average Convergence Divergence formula, so the main characteristic of indicator is double smoothing, which increases the reliability of signal for turn and allows you to identify the strongest trend. Chronic delay becomes a payment for it that is almost imperceptible at trend trade and devilishly disturbs at a scalping.
Calculation formula of:
- MACD=EMA(PL, close) − EMA(PS, close), where EMA – exponential MA;
- PL, PS − the long and short periods, as a result, it gives the fast MACD line (or the histogram).
The value of short average is subtracted from the value of long and once again averages as the simple MA, to remove random waves, as a result, we receive a so-called signal line: Signal=SMA (MACD,PA), where SMA – simple moving average, PA – its signal period. Moving Average Convergence Divergence indicator is placed in an additional window with a zero line, but sometimes there are variants with placing directly on the price chart. For example, Awesome Oscillator (AO) is a modified version of MACD with constant parameters of moving averages.

By default, MACD parameters (12, 26, 9) are offered – optimal for the hourly chart on all popular assets. When setting up, it is necessary to take into account the actual volatility and the analysis period – the more timeframe, the more “long” averages need to be included in the calculation. The smaller the period of moving averages used in calculation, the more false signals should be expected, which is why all versions of the indicator are recommended to be used for periods from H1 and higher.
Trade indicator signals
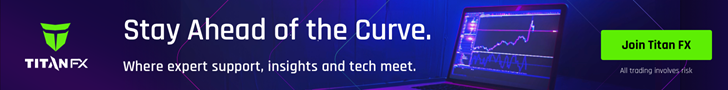
It is accepted to distinguish two modifications of indicator: a linear and MACD-histogram, the size of histogram shows the range of volatility. The intersection point of zero-line histogram corresponds to the intersection of moving averages.
The trading signal is the mutual arrangement of histogram and zero line:
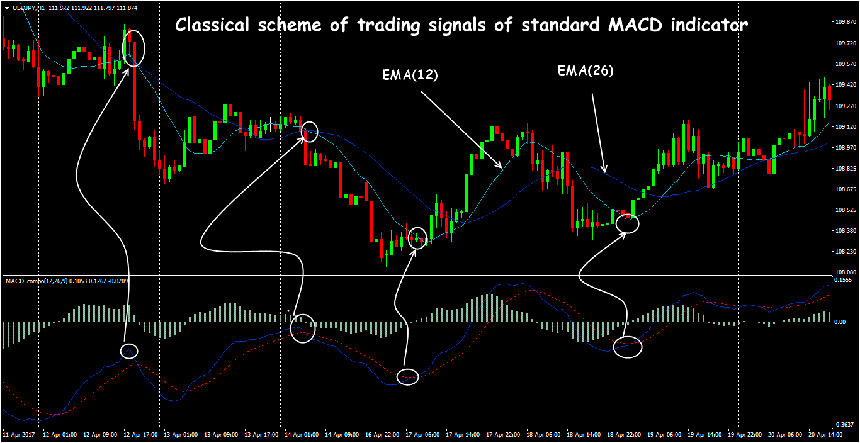
- histogram below zero line (negative, MACD line is below signal line) – downtrend in priority;
- histogram crosses zero line (MACD line crosses signal line) – the signal to turn;
- a histogram above zero line (positive, MACD above signal line) is an uptrend.
Most often, the movements on histogram outpace movement of Moving Average Divergence Convergence indicator.

Signal will be more reliable if after intersection of lines on histogram there is a next maximum (SELL), or a minimum (BUY).
Sometimes it is advantageous to use indicators with a color histogram – it shows the moment of change of direction. This fact should be paid special attention, although this does not guarantee a violation of the balance of market players. Sure growth – buying, stable falling – time to SELL.

The new max on histogram MACD warns that on the current uptrend it is also worth waiting for new levels above the current one; when a new min appears on histogram – for a downtrend we argue similarly.
Advertisement

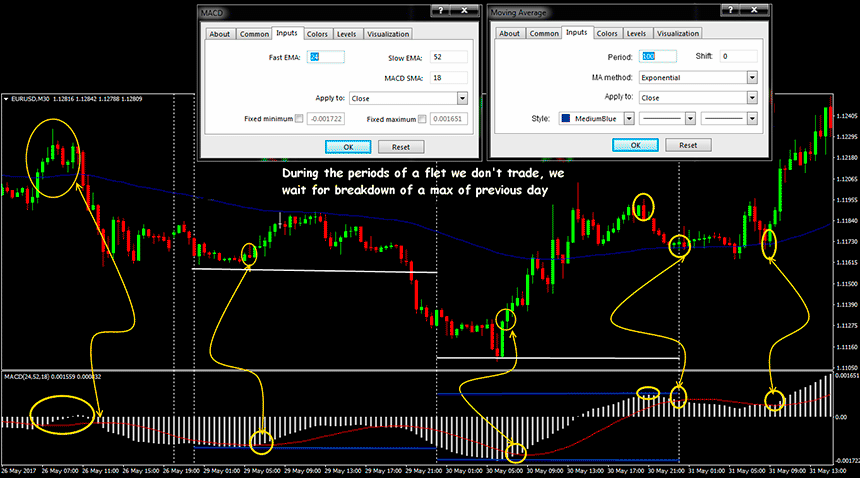
In the case of an explicit flat, appearance of max on MACD can be considered a weak signal for sale, that is, at time of breakdown, there will be more chances of falling prices. When min appears – a weak signal to buy suggests that after breakdown, buyers will be stronger.

The behavior of histogram allows not just to estimate who stronger in game «bulls»/«bears», but also the speed of development of a tendency. A histogram inclination up – buyers act more actively (that on Forex is perceived as is «stronger»), an inclination down – sellers. Change of the direction of an inclination is a trade signal of MACD histogram: from below up − on purchase; from top to down − for sale. If price increases visually and the histogram starts to go down, it means that growth slows down, that is, you need to gradually close your purchases and start looking for entry points to SELL transactions. The growth of the histogram on bearish trend recommends (at least!), move StopLoss in sales deals closer to the current price and prepare for a reversal up.
Strategy with use of the indicator
Moving Average Divergence Convergence indicator does not understand the term “critical zones” and is not suitable for estimating overbought/oversold levels. For trend trading, this is advantageous – all false noises are cut off, but for scalping, the entry point lags.
At the same time, it is possible to identify and use standard graphic patterns, for example, “Head-Shoulders” on MACD histogram. Below − trading scheme MACD + trading trend line + support/resistance levels:
The strongest signal of MACD indicator is the situation of convergence/divergence of moving averages with direction of price. Divergence means that the current trend is weakening – a reversal is possible, a strong correction, or at least a transition to a flat. Movement in the direction of a point of intersection of moving averages which corresponds to zero bar on the histogram is called a convergence. Situation at which direction of moving averages disperses from direction of histogram is called divergence.

Situation of “bearish” (moving average convergence) implies a downward turn, “bullish” (moving average divergence) – we are waiting for turn up. The higher timeframe, on which divergence is visible, more serious signal is.
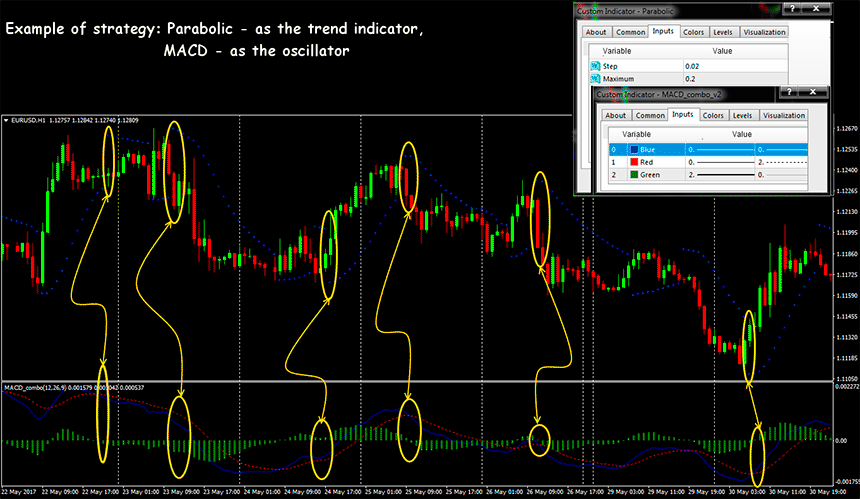
MACD+Parabolic trend strategy is actively used: it is beneficial that in this system both indicators are not redrawn. Analysis is recommended to be carried out for a period not less than M30, to accompany transactions – to H1 and higher; logic is the standard for these indicators. The basic generator of trading signals is Parabolic, and if there is no confirmation from MACD after break on line for three candles, signal should be ignored.
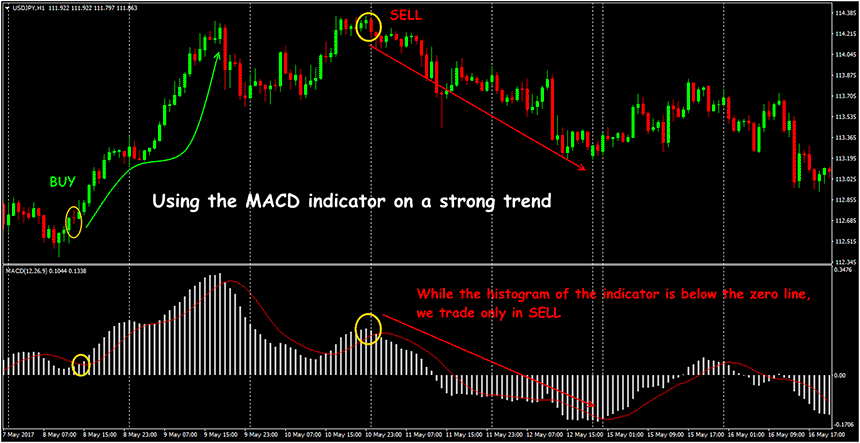
In practice, MACD+Stochastic kits with different parameters proved to be very good. Oscillators work well in an unstable market and at turning points, but in a strong trend, confidence in them decreases, while MACD signals appear less often, but they are more reliable and perform task of an additional filter.
There are no accurate overbought/oversold levels on MACD indicator, Moving Average Convergence Divergence analysis of price range should be carried out «approximately». The levels 0.008-0.009 have well proved on graphics of the histogram, points of the breakthrough of such level can be considered the beginning of a correction, and this signal turns out even more reliable, than at traditional oscillators.
Several practical notes
Main advantage of MACD indicator – it is a trend.His signals will not allow you to open a deal against the most powerful movement. Disadvantage of Moving Average Divergence Convergence − is that it is a trend indicator. 75-80% of the trading time market is in flat (in another range), and then possibility of reliable MACD signals appears very rarely.
It is interesting that habitual to all by default parameters (12,26,9) Gerald Appel recommended only for persons interested to sell, and for buyers, in his opinion, more approach (8,17,5). Persons interested can independently experiment.
Small timeframes need to be very careful: moving average convergence and divergence are considered weak and, more often, false. Trust only causes situations on periods of at least H1.
Related: What Is Forex Trading? Beginner Guide 2026 (Complete & Honest)
Using the fine-tuning of moving averages, MACD indicator can be effectively applied in any market, but it is not recommended to use it without additional signal filtering.
Before trading GOLD (XAUUSD)
Professional traders check the market regime first:
- Is the market window OPEN or CLOSED?
- Should I favor BUY or SELL?
- How risky is the current regime?
👉 Follow the Gold Decision Engine (market context — not a signal service)
View Gold Decision Engine →Related posts:
 How Can I Start Forex Trading in 2026? A Complete Beginner-to-Pro Guide
 What Is Forex Trading? Beginner Guide 2026 (Complete & Honest)
 How Forex Market Works (Explained Simply) – Beginner Guide 2026
 What Are Currency Pairs in Forex? Beginner Guide 2026
 How Forex Trading Makes Money – Beginner Guide 2026