
Read Technical Analysis – Price Action Trading (Part 2)
Support and Resistance
In Forex trading, support and resistance refers to levels where price is likely to pause, bounce or even reverse. Support is a lower price point or zone where the currency pair is considered ‘cheap’, spurning buying interest. Resistance is an upper price point or zone where the pair is considered ‘expensive’ and is likely to encounter sellers:

In the above example, the Australian Dollar is finding buyers around 7150, but encountering strong selling interest above 7250 – note pair spikes above 7250 resistance five times, but is unable to close above there. It is also worth noting that when there’s an hourly close below 7150 support, pair is then unable to close back above the level – former support is now acting as resistance:
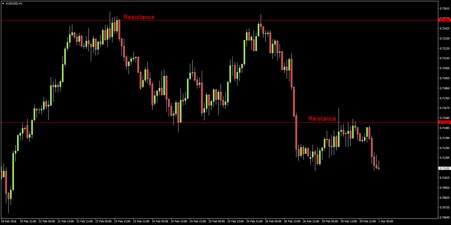
This is a fairly common occurrence in Forex trading – levels that previously encouraged buying interest will nearly always encourage selling interest after they break down (and vice versa).
You’ve heard the old saying “Buy Low, Sell High”? Forex traders look to sell into resistance and buy into support, this leads to higher probability setups, allows the trader to set tight stops and leaves plenty of room for rewarding trades.
Advertisement

Now we’ve had a look a horizontal support and resistance, let’s take a quick look at trend resistance and support:
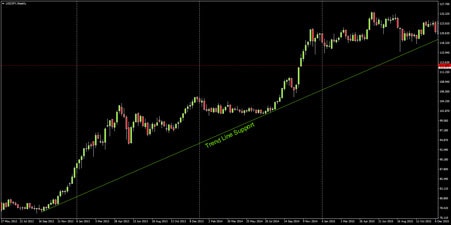
This is the trend line that supported USDJPY from September 2012 – January 2016. Note pair finds buying interest whenever price nears trend support.

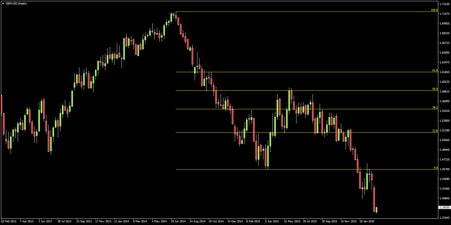
Here we have the recent down trend in GBPUSD, note pair is unable to close the week above trend line resistance and eventually turns lower.
Remember: If you want high probability, rewarding setups – Buy low, sell high – buy into support, sell into resistance.
Fibonacci
Fibonacci retracements are a quick and easy way of predicting support and resistance levels in Forex.
The Fibonacci tool works on the principle that markets tend to ‘retrace’ a portion of a move prior to continuing the dominant trend. Traders use the Fibonacci tool on MT4 to connect the lows and highs of a recent trend, swing or range and the tool displays likely support and resistance levels derived from the Fibonacci Sequence (Golden Ratio). Fibonacci levels appear again and again in Forex – this tool is surprisingly reliable when it comes to predicting support and resistance:
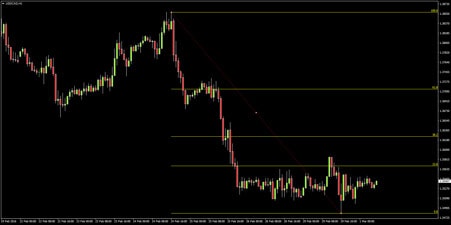
This is the recent down move in USDCAD. If we use the Fibonacci tool to connect the previous peak to the range low, we are shown three potential resistance levels. The standard Fibonacci retracement levels are 23.6, 38.2 & 61.8, but many traders also use the 78.6 and 50 levels. 50 is not actually derived from the Fibonacci sequence, but the importance of the level cannot be denied – 50% retracements are very common place:
Let’s take another look at USDCAD:
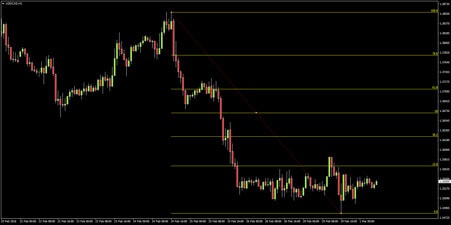
Despite a false break above in late February, pair is essentially capped by the 23.6 Fib. Above the 23.6 we have the 38.2, a break above the 23.6 would likely encounter resistance here. These levels are very common; a trend can retrace these percentages and still be considered healthy. Next we have the 50% mark, note this level is important as it coincides with former support. Above 50% and traders are beginning to question the recent move – is this a retracement or a reversal? Having said that; 61.8 retracements, prior to continuation are also fairly common. The 78.6 is considered the be all and end all – if a pair retraces more than 78.6% of the prior move, chances are it’s heading straight back to the origin (100%). It may have completely reversed direction or is range bound.
A trader with a bearish bias on USDCAD would wait for a break above the 23.6 and look for a reaction at one of the higher fib levels, before entering short. On the other hand, a trader with a bullish bias might trade a break above the 23.6 with a stop below the recent lows, or wait for a break above one of the higher fibs.
The previous examples were all assessing down moves; let’s take a look at an up move:

The process is the same, but instead of dragging the Fibonacci tool from the high to the low; we drag it from the low to the high. A trader looks at this chart and see’s USDCHF is trending up and decides they want to buy. They know not to buy into resistance, so they use the Fibonacci tool to identify probable support levels. They notice that price seems to be respecting the 50% level and decide they will attempt to enter long there. They have two options:
1) Watch and wait for a correction to, reaction at the 50% level.
2) Place a Buy Limit order just above the 50% level.
The first option is probably ‘safer’, as the trader is not blindly buying into a potential support level. On the other hand, the second option means the trader does not have to sit and watch the market. Either way, our trader has four options for placing their stop, depending on their risk tolerance:
1) A tight stop just below the 50% level.
2) A more reasonable stop below the 61.8.
3) A considerably looser stop below the 78.6.
4) A stop below 100 – if price moves below here the trader’s bullish bias is unquestionably invalidated as pair has set a new low.
The first option is likely a little too risky, most traders would probably opt for the balanced choice under the 61.8. With the latter two, the trader risks holding on to a losing position for longer than necessary and is sacrificing reward.
Fibonacci Retracements are a great way of identifying potential support and resistance levels. When analysing a down move, the trader uses the tool from the high to the low. When looking at a rally, the trader drags from the low to the high. The standard 23.6, 38.2 and 61.8 Fib levels are great, but many Fibonacci traders add in the 78.6 and 50 levels too. Trade breaks of key Fibs or reactions, depending on your strategy and bias.
Source: VT Markets –
Before trading GOLD (XAUUSD)
Professional traders check the market regime first:
- Is the market window OPEN or CLOSED?
- Should I favor BUY or SELL?
- How risky is the current regime?
👉 Follow the Gold Decision Engine (market context — not a signal service)
View Gold Decision Engine →Related posts:
 How Can I Start Forex Trading in 2026? A Complete Beginner-to-Pro Guide
 What Is Forex Trading? Beginner Guide 2026 (Complete & Honest)
 How Forex Market Works (Explained Simply) – Beginner Guide 2026
 What Are Currency Pairs in Forex? Beginner Guide 2026
 How Forex Trading Makes Money – Beginner Guide 2026